The Gold to Silver ratio is a widely followed metric in the precious metals investing community. It reflects the relative value of gold and silver, helping investors identify potential investment opportunities. In this article, we will explore the historical significance of the Gold to Silver ratio, how it’s calculated, and its relevance for modern-day investors. We will also discuss how the ratio can be used to make better-informed investment decisions in the gold and silver market and where to find today’s ratio.
The Gold to Silver Ratio: A Brief History
The Gold to Silver ratio has been used as a measure of relative value between the two precious metals since ancient times. It was formalized in the United States with the Coinage Act of 1792, which established a fixed ratio of 15:1. This meant that 15 ounces of silver were equivalent to one ounce of gold. Over time, the ratio has fluctuated significantly, with the average hovering around 60:1 in the last century.
Calculating the Gold to Silver Ratio
The Gold to Silver ratio is calculated by dividing the price of an ounce of gold by the price of an ounce of silver. The resulting number represents how many ounces of silver it takes to buy one ounce of gold. For example, if gold is trading at $1,800 per ounce and silver at $30 per ounce, the ratio would be 60:1.
Using the Gold to Silver Ratio in Investment Decisions
The Gold to Silver ratio is a valuable tool for investors to identify potential investment opportunities in the precious metals market. Here are some ways in which the ratio can be utilized:
- Mean Reversion: The Gold to Silver ratio has historically reverted to its long-term average, which suggests that when the ratio is significantly above or below its historical mean, it may indicate an opportunity to invest in the undervalued metal.
- Diversification: The ratio can help investors diversify their precious metals portfolio by identifying the right balance between gold and silver. When the ratio is high, investors might consider allocating more capital to silver, and when it is low, they might opt for gold.
- Market Sentiment: The Gold to Silver ratio can also act as a gauge for market sentiment. A high ratio may indicate pessimism in the market, as investors flock to gold as a safe haven, while a low ratio may signal optimism and increased industrial demand for silver.
A Deeper Dive into the Gold to Silver Ratio – Factors Influencing the Ratio
The Gold to Silver ratio is subject to various economic and market factors, which can cause it to fluctuate over time. Some key factors include:
- Industrial Demand: Silver has more industrial applications compared to gold, which primarily serves as a store of value and an investment asset. As a result, silver demand is more closely tied to economic cycles, leading to larger fluctuations in its price and, consequently, the Gold to Silver ratio.
- Central Bank Policies: Central banks around the world hold large reserves of gold, but rarely hold silver. Changes in central bank policies, such as increasing or decreasing gold reserves, can impact gold prices and the Gold to Silver ratio.
- Investment Demand: Both gold and silver are considered safe-haven assets in times of economic uncertainty. However, gold tends to attract more attention from investors, leading to a higher demand and an increase in the Gold to Silver ratio.
- Mining Production: Changes in gold and silver mining production can impact their respective prices and the Gold to Silver ratio. Factors like new mining discoveries, technological advancements, and regulatory changes can influence mining production.
Historical Gold to Silver Ratio Extremes
Throughout history, the Gold to Silver ratio has reached notable extremes. Some instances include:
- Early 1980s: The ratio climbed above 90:1 during the 1980 recession, as investors sought the safety of gold amidst economic uncertainty.
- Late 1990s: The ratio spiked to over 100:1 during the late 90s, as gold prices declined due to the strength of the U.S. dollar and the Asian financial crisis.
- 2011: The ratio dipped to 32:1,
assilver prices soared due to increased investment demand and concerns about global inflation.
Understanding these historical extremes can help investors gauge the potential for future fluctuations in the Gold to Silver ratio and identify potential investment opportunities.
Current Gold to Silver Ratio
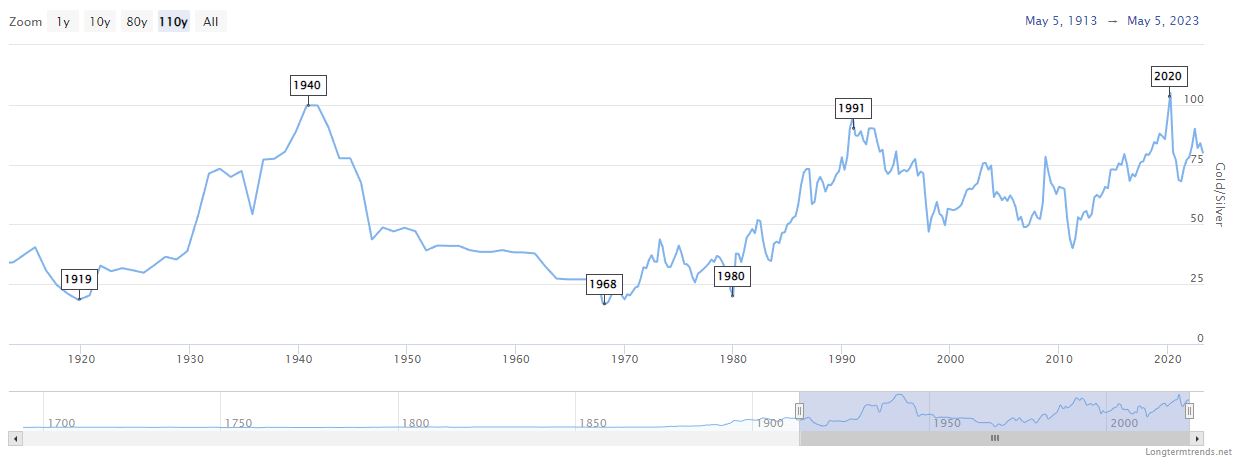
To stay informed about the current Gold to Silver ratio, I regularly visit Longtermtrends.net, which provides reliable and up-to-date information on the ratio. In fact, I even captured a screenshot from the website to include at the beginning of this article.
Remember, the Gold to Silver ratio is a powerful tool that offers precious metal investors valuable insights into market dynamics and potential opportunities. By monitoring the ratio and understanding the factors that drive its fluctuations, investors can make more informed decisions about when to invest in gold or silver. As the global economy continues to evolve, the Gold to Silver ratio remains a crucial indicator to watch for those interested in the precious metals market.