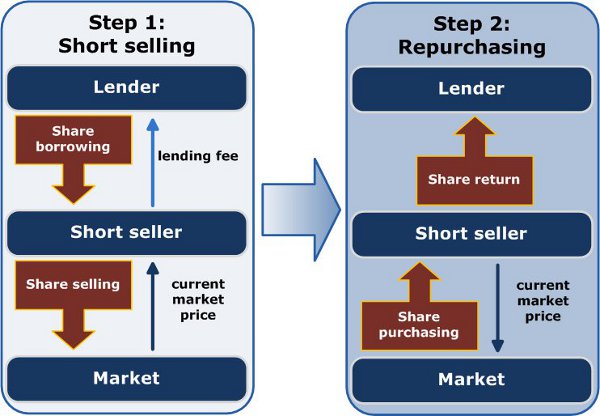
Short selling is a trading strategy where an investor borrows shares from their broker and sells them on the open market with the expectation that the stock price will decrease. The short seller then waits for the stock price to drop before buying back the shares on the open market at a lower price, and returning them to the broker.
The profit for the short seller is the difference between the price they received from selling the borrowed shares and the price they paid to buy them back. During the waiting period, the short seller has a short position in the stock.
Schematic representation1 of short selling in two steps:
There is an interesting article written on Investopedia about When to Short a Stock which you can read by clicking on this link.
Short Interest Data
Brokerage firms are required to report the number of shares that have been sold short in their client accounts to the appropriate regulators twice a month. This information is then totalized for each stock and released to the public.
Short interest is the total number of shares of a stock that have been sold short by investors but have not yet been covered or closed out. Stocks with a high short interest can be risky for two reasons:
- Many investors may believe that the stock price will fall due to the high short interest, which could result in a self-fulfilling prophecy;
- Speculators may buy stocks with a high short interest in the hope of a short squeeze. A short squeeze occurs when the price of a stock with a high short interest begins to rise, and short sellers reverse their positions, adding to the demand by buying shares to cover their short positions. This can cause the share price to increase further.
3 Indicators for Measuring Short Interest Levels
There are three key indicators that are commonly used to measure the level of short interest in a stock: the short interest (as a percentage of a stock’s total amount of shares outstanding), the short interest as a percentage of a stock’s total float and the short interest ratio.
1. Short Interest
Short interest percentage is calculated by dividing the total amount of shares sold short by the total amount of shares outstanding, expressed as a percentage. Changes in short interest can provide insights into market sentiment towards a stock’s expected price direction. An increase in short interest suggests a greater belief that the stock price will decline, while a decrease suggests the opposite.
According to the report “Does Short Selling Amplify Price Declines or Align Stocks with their Fundamental Values?“, by Asher Curtis and Neil Farger, the average short interest is 2.4%.
2. Short Interest as Percentage of Float
The float is calculated by subtracting insider and institutional ownership from a company’s total shares outstanding, and represents the total number of shares available for trading. Short interest as a percentage of float is calculated by dividing the total amount of shares sold short by the float. This ratio provides additional insights into market sentiment regarding a stock’s expected price direction.
As a rule, I believe corporate insiders and institutions combined should own a minimum of 5% of a company’s shares, with the maximum float set at 95% of the total shares outstanding. Applying these percentages, the average short interest as a percentage of float is calculated to be 2.5% (2.4% x 100 / 95).
For companies with a market cap of less than 100 million, I believe the minimum combined share ownership of insiders and institutions should be higher than that of larger companies. Therefore, I do not consider a ratio slightly over 2.5% to be really negative for companies with a market cap of less than 100 million.
3. Short Interest Ratio
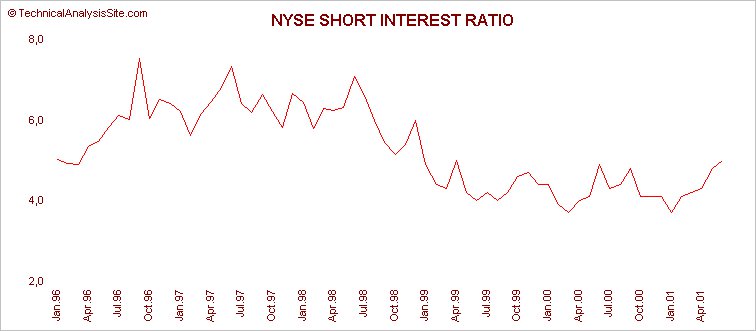
The short interest ratio is calculated by dividing the total short position by the average daily trading volume, which is usually calculated over the last 30 trading days. The ratio is also referred to as “days to cover” because it estimates how many days it would take for short sellers to buy back all of their shorted shares at the stock’s average daily trading volume. A higher short interest ratio means that the stock is more vulnerable to a short squeeze, as it would take longer for short sellers to buy back the shares necessary to close their short positions.
Based on my analysis of data available online, the average short interest ratio range is between 4 and 6. For instance, the graph below shows the NYSE short interest from 1996 to 2001.
Where To Find Short Interest Data
If you’re looking for information on short stock positions, short interest, and days to cover, you might be wondering where to find this online data. Luckily, there are some excellent free resources available. Since my stock portfolio is mainly focused on Canadian and American stocks, I’ll describe the best free resources for accessing this information below.
Canadian Short Stock Positions
To analyse the short stock positions of a specific Canadian stock, you can best use the Short Position Tool from Stockwatch.com. Short positions for the TSX and TSX-Venture are reported twice a month (on the 15th and last day of every month). Stockwatch.com receives the actual reports three days later and updates this data on their website.
American Short Stock Positions
To view the short positions of all American-listed companies, go to shortsqueeze.com. Additionally, HighShortInterest.com provides a convenient sorted database of stocks that have a short interest of over 20 percent.