Abstract
During the pre-recession years of the 21st century, we experienced wide-ranging non renewable natural resource (NNR) scarcity on a global scale for the first time. Supplies associated with an overwhelming majority of the global energy resources, metals, and minerals that enable our industrialized way of life failed to keep pace with increasing global demand during the 2000-2008 period, resulting in global NNR supply shortfalls.
Global NNR scarcity will intensify going forward, as global economic activity levels, economic growth rates, and corresponding NNR demand return to their pre-recession levels; and global NNR supply levels continue to approach and reach their geological limits. The debilitating societal effects associated with global NNR scarcity, which we experienced to a limited degree during the Great Recession, will also intensify going forward, as temporary global NNR supply shortfalls become permanent.
The Global non renewable Natural Resource Scarcity Assessment quantifies the scope associated with global NNR scarcity, both prior to the Great Recession and going forward, by analyzing global production (extraction) data, price data, and reserve base estimates associated with a broad array of energy resources, metals, and minerals.
The salient findings associated with the assessment: 50 of the 57 analyzed NNRs (88%) experienced global scarcity during the 2000-2008 period; 23 of the 26 analyzed NNRs (88%) will likely experience permanent global supply shortfalls by the year 2030.
At the end of the day, we are not about to “run out” of any NNR; we are about to run “critically short” of many. This reality will have a devastating impact on our industrial lifestyle paradigm.
Introduction
Non Renewable Natural Resources — the Enablers of Industrialization
Our industrial1 lifestyle paradigm is enabled by non renewable natural resources (NNRs)—energy resources, metals, and minerals. Both the support infrastructure within industrialized nations and the raw material inputs into industrialized economies consist almost entirely of NNRs; NNRs are the primary sources of the tremendous wealth surpluses required to perpetuate industrialized societies.
As a case in point, the percentage of NNR inputs into the US economy increased from less than 10% in the year 1800, which corresponds roughly with the inception of the American industrial revolution, to approximately 95% today.2,3 Between 1800 and today, America’s total annual NNR utilization level increased from approximately 4 million tons to nearly 7 billion tons—an increase of over 1700 times!4
In the absence of enormous and ever-increasing NNR supplies, the 1.2 billion people5 who currently enjoy an industrialized way of life will cease to do so; and the billions of people aspiring to an industrialized way of life will fail to realize their goal.
Non Renewable Natural Resource (NNR) Scarcity
As their name implies, NNRs are finite—they are not replenished by Nature;6 and they are scarce—economically viable NNR deposits are rare. Persistent extraction (production) will therefore deplete recoverable NNR reserves to exhaustion. [Note: the terms NNR “production” and NNR “extraction” are used interchangeably throughout the paper. Although “extraction” is the proper term—humans do not produce NNRs—the term “production” has gained wide acceptance within the NNR extraction industries.]
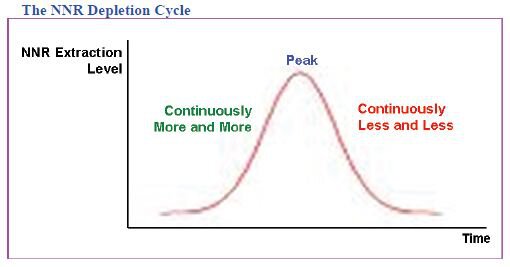
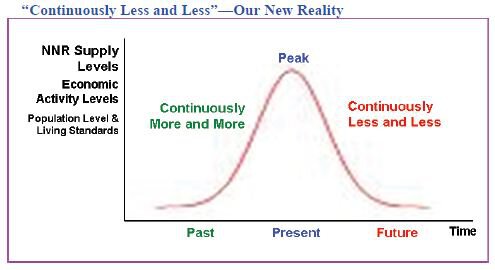
The typical NNR depletion cycle 7 is characterized by:
a period of “continuously more and more”, as the easily accessible, high quality, low cost resources are extracted; followed by a “supply peak”,8 or maximum attainable extraction level; followed by a period of “continuously less and less”, as the less accessible, lower quality, higher cost resources are extracted.
Since the inception of our industrial revolution, humanity has been the beneficiary of “continuously more and more” with respect to available NNR supplies. Unfortunately, in the process of reaping the benefits associated with “continuously more and more”, we have been eliminating—persistently and systematically—the very natural resources upon which our industrialized way of life depends.
Increasingly, global NNR supplies are transitioning from “continuously more and more” to “continuously less and less”, as they peak and go into terminal decline. As a result, NNRs are becoming increasingly scarce—ever-tightening global NNR supplies are struggling to keep pace with ever-increasing global demand.
The Analyses
The following Global non renewable Natural Resource Scarcity Assessment quantifies the magnitude associated with increasing global NNR scarcity and the probabilities associated with imminent and permanent global NNR supply shortfalls. The assessment consists of two analyses, both of which are based on US Geological Survey (USGS) and US Energy Information Administration (EIA) data.9
- The Global NNR Scarcity Analysis assesses the incidence of global scarcity associated with each of 57 NNRs during the period of global economic growth (2000-2008) prior to the Great Recession.
- The Global NNR Supply Shortfall Analysis assesses the probability of a permanent global supply shortfall associated with each of 26 NNRs between now and the year 2030.
Summary Findings
Global Non Renewable Natural Resource (NNR) Scarcity Analysis Summary Findings
Fifty (50) of the 57 analyzed NNRs (88%) experienced some level of global scarcity during the period of global economic growth (2000-2008) that preceded the Great Recession.

Global Non Renewable Natural Resource (NNR) Supply Shortfall Analysis Summary Findings
Twenty three (23) of the 26 analyzed NNRs (88%) will likely experience a permanent global NNR supply shortfall by the year 2030.
Global Non Renewable Natural Resource (NNR) Scarcity Analysis
The Global NNR Scarcity Analysis is based on US Geological Survey (USGS) and US Energy Information Administration (EIA) data related to global production and pricing associated with fifty seven (57) NNRs—energy resources, metals, and minerals.
Global Non Renewable Natural Resource (NNR) Scarcity

In a general sense, NNR scarcity exists when aggregate NNR supply is insufficient to meet aggregate NNR demand; the result is unfulfilled NNR demand. Ongoing NNR scarcity is characterized by an increasing NNR price level, which fails to induce sufficient incremental NNR supply to suppress the price level.
Global Non Renewable Natural Resource (NNR) Scarcity Analysis Overview
The Global NNR Scarcity Analysis assesses the incidence of global scarcity associated with 57 NNRs during the period of global economic growth (2000-2008) prior to the Great Recession.
Specifically, the analysis compares annual global NNR production data and NNR pricing data10 from the 20th century with that of the pre-recession 21st century (2000-2008). NNRs considered “scarce” during the 2000-2008 period are those for which 21st century global NNR production levels were insufficient to suppress rising 21st century price levels.
NNR scarcity levels are defined by the following NNR production level and price level combinations:


Global Non Renewable Natural Resource (NNR) Scarcity Assessment
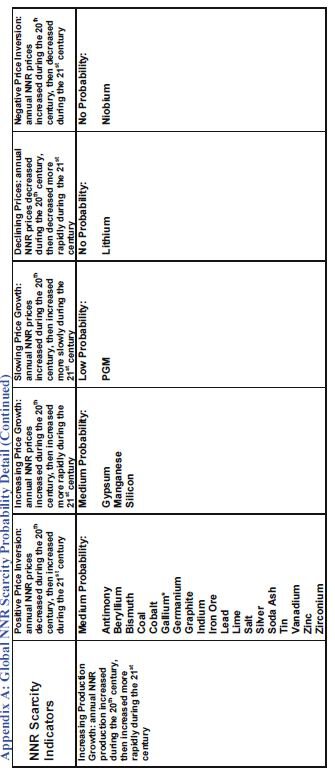
The following table contains 20th century and 21st century global production trend data and price trend data for each of the 57 analyzed NNRs. Specifically, it contains the compound annual growth (decline) rates associated with global NNR production levels and NNR price levels during the 20th century and 21st century (2000-2008). The table also notes the level of scarcity experienced by each NNR during the 2000 to 2008 time period. (See Appendix A: Global NNR Scarcity Probability Detail.)


Macro Level Global Non Renewable Natural Resource (NNR) Scarcity Assessment
During the 20th century, global production levels associated with 56 of the 57 analyzed NNRs (98%) increased annually, while global price levels associated with 45 of the 57 analyzed NNRs (79%) decreased annually.
Generally increasing global NNR production levels in conjunction with generally decreasing global NNR price levels indicate relative global NNR abundance during the 20th century. On the whole, global NNR supplies kept pace with ever-increasing global demand during the 20th century.
During the pre-recession years of the 21st century (2000-2008), annual global production level growth rates associated with 34 of the 57 analyzed NNRs (59%) decreased in comparison to 20th century growth rates, or actually went negative; while annual global price level growth rates associated with 51 of the 57 analyzed NNRs (89%) increased in comparison to 20th century growth rates.
Generally slowing or declining global NNR production growth in conjunction with generally increasing global NNR prices indicate increasing NNR scarcity during the early years of the 21st century—annual global NNR supplies were increasingly unable to keep pace with ever-increasing global demand.
Micro Level Global Non Renewable Natural Resource (NNR) Scarcity Assessment
Fifty (50) of the 57 analyzed NNRs (88%) experienced some level of global scarcity during the 2000-2008 period:
Available global supplies associated with mercury became extremely scarce during the 2000-2008 period. Annual global production levels decreased during the 20th century, then decreased more rapidly during the 21st century; while annual price levels decreased during the 20th century, then increased during the 21st century.
Assessment: available global supplies decreased throughout the total period, despite unfulfilled demand during the 21st century, as evidenced by increasing 21st century price levels—global supply could not keep pace with increasing demand.
Available global supplies associated with bromine, gold, and tantalum became extremely scarce during the 2000-2008 period. Annual global production levels increased during the 20th century, then decreased during the 21st century; while annual price levels decreased during the 20th century, then increased during the 21st century.
Assessment: available global supplies decreased during the 21st century, after having increased during the 20th century, despite unfulfilled demand during the 21st century, as evidenced by increasing 21st century price levels—global supplies could not keep pace with increasing demand.
Available global supplies associated with thallium became extremely scarce during the 2000-2008 period. Annual global production levels increased during the 20th century, then decreased during the 21st century; while annual price levels increased during the 20th century, then increased more rapidly during the 21st century.
Assessment: available global supplies decreased during the 21st century, after having increased during the 20th century, despite unfulfilled demand, as evidenced by (more rapidly) increasing 21st century price levels—global supply could not keep pace with increasing demand.
Available global supplies associated with aluminum, bauxite, cadmium, cement, chromium, molybdenum, nickel, nitrogen, phosphate rock, potash, rare earth minerals (REM), rhenium, selenium, sulfur, and tungsten became very scarce during the 2000-2008 period. Annual global production levels increased during the 20th century, then increased more slowly during the 21st century; while annual price levels decreased during the 20th century, then increased during the 21st century.
Assessment: global supply growth slowed during the 21st century despite unfulfilled demand, as evidenced by increasing 21st century price levels—global supplies could not keep pace with increasing demand.
Available global supplies associated with copper, fluorspar, magnesium compounds, natural gas, oil, and strontium became very scarce during the 2000-2008 period. Annual global production levels increased during the 20th century, then increased more slowly during the 21st century; while annual price levels increased during the 20th century, then increased more rapidly during the 21st century.
Assessment: global supply growth slowed during the 21st century despite unfulfilled demand, as evidenced by (more rapidly) increasing 21st century price levels—global supplies could not keep pace with increasing demand.
Available global supplies associated with antimony, beryllium, bismuth, coal, cobalt, gallium, graphite, indium, iron ore, lead, lime, salt, silver, soda ash, tin, vanadium, zinc, and zirconium, became moderately scarce during the 2000-2008 period. Annual global production levels increased during the 20th century, then increased more rapidly during the 21st century; while annual price levels decreased during the 20th century, then increased during the 21st century.
Assessment: global supply growth increased during the 21st century, but not sufficiently to keep pace with demand, as evidenced by increasing 21st century price levels—global supplies could not keep pace with increasing demand.
Available global supplies associated with gypsum, manganese, and silicon, became moderately scarce during the 2000-2008 period. Annual global production levels increased during the 20th century, then increased more rapidly during the 21st century; while annual price levels increased during the 20th century, then increased more rapidly during the 21st century.
Assessment: global supply growth increased during the 21st century, but not sufficiently to keep pace with demand, as evidenced by (more rapidly) increasing 21st century price levels—global supplies could not keep pace with increasing demand.
Available global platinum group metal (PGM) supplies became marginally scarce during the 2000-2008 period. Annual global production levels increased during the 20th century, then increased more rapidly during the 21st century; while annual price levels increased during the 20th century, then increased more slowly during the 21st century.
Assessment: global supply growth increased during the 21st century, but barely sufficiently to keep pace with demand, as evidenced by increasing, albeit more slowly, 21st century price levels—global supplies struggled to keep pace with demand.
Available global supplies associated with arsenic, barite, industrial diamond, and garnet were not scarce during the 2000-2008 period. Annual global production levels increased during the 20th century, then increased more slowly during the 21st century; while annual price levels decreased during the 20th century, then decreased more rapidly during the 21st century.
Assessment: decreasing global production levels in conjunction with decreasing price levels indicate declining demand during the 21st century—global supplies were more than sufficient to keep pace with declining demand.
Available global supplies associated with boron were not scarce during the 2000-2008 period. Annual global production levels increased during the 20th century, then decreased during the 21st century; while annual price levels decreased during the 20th century, then decreased more rapidly during the 21st century.
Assessment: decreasing global 21st century production levels in conjunction with decreasing price levels indicate declining demand during the 21st century—global supply was more than sufficient to keep pace with declining demand.
Available global supplies associated with niobium were not scarce during the 2000-2008 period. Annual global production levels increased during the 20th century, then increased more rapidly during the 21st century; while annual price levels increased during the 20th century, then decreased during the 21st century.
Assessment: increasing global production levels in conjunction with decreasing 21st century price levels indicate abundant supply during the 21st century—increasing global supply was more than sufficient to keep pace with demand.
Available global supplies associated with lithium were not scarce during the 2000-2008 period. Annual global production levels increased during the 20th century, then increased more rapidly during the 21st century; while annual price levels decreased during the 20th century, then decreased more rapidly during the 21st century.
Assessment: increasing global production levels in conjunction with decreasing price levels indicate abundant supply during the 21st century—increasing global supply was more than sufficient to keep pace with demand.
Global Non Renewable Natural Resource (NNR) Scarcity Analysis Findings
An overwhelming majority (88%) of the analyzed NNRs—50 out of 57—experienced some level of global scarcity during the pre-recession years of the 21st century; available global supplies associated with these NNRs could not keep pace with demand during the 2000-2008 period. At issue is whether this phenomenon is temporary or permanent.
In some cases, global NNR scarcity during the early 21st century was undoubtedly a temporary phenomenon. Sufficient additional NNR reserves existed to fulfill global requirements; but they could not be produced quickly enough to keep pace with ever-increasing demand—possibly due to geopolitical constraints or to the lack of sufficient capital investment. Remaining supplies associated with these NNRs will be sufficient to contribute toward the complete restoration of prerecession global economic activity levels and growth rates (this time).
In other cases, global NNR scarcity is a permanent condition; available NNR supplies were physically (geologically) unable to keep pace with ever-increasing demand during the 2000-2008 period. Remaining supplies associated with these NNRs are no longer sufficient to contribute fully toward pre-recession global economic activity levels and growth rates.
Given that industrialized and industrializing nations will attempt to recover from the Great Recession as quickly as possible—thereby restoring or exceeding pre-recession economic activity levels and growth rates—it will soon become evident which NNRs experienced temporary global scarcity during the early 21st century and which experienced permanent global scarcity.
It will certainly become evident that an increasing number of NNRs are becoming increasingly scarcity globally, as ever-tightening global NNR supplies fail increasingly to keep pace with relentlessly increasing global NNR demand. And while we may recover fully from the Great Recession, permanent global NNR supply shortfalls will preclude our full recovery from a subsequent global economic contraction at some point in the not-too-distant future.
Global Non Renewable Natural Resource (NNR) Shortfall Analysis
The Global NNR Supply Shortfall Analysis is based on US Geological Survey (USGS) and US Energy Information Administration (EIA) global NNR extraction data and (Verhulst) logistics curve fitting analyses 11 associated with 26 NNRs.
Global Non Renewable Natural Resource (NNR) Supply Shortfalls
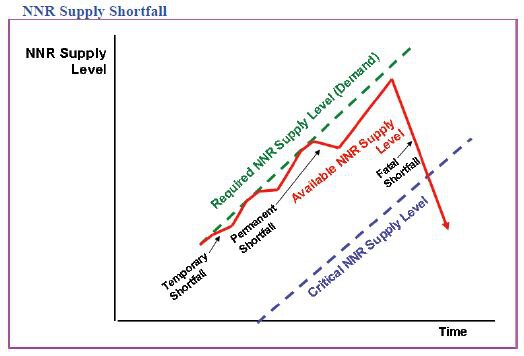
An NNR supply shortfall occurs when the available NNR supply level is less than the supply level required to enable a society’s prevailing economic activity level and growth rate. An NNR supply shortfall can be temporary, permanent, or fatal.
A temporary NNR supply shortfall occurs when the available NNR supply level falls below the “required” supply level for a finite period of time. Since the available NNR supply level ultimately recovers to the required level, the society’s pre-shortfall economic activity level and growth rate are restored.
A permanent NNR supply shortfall occurs when the available NNR supply level falls below the “required” supply level forever. Since the available NNR supply level never recovers to the required level, the society’s pre-shortfall economic activity level and growth rate are not restored.
A fatal NNR supply shortfall occurs when the available NNR supply level falls below the “critical” supply level forever. At this point, available NNR supply can no longer enable the production and provisioning of one or more societal essentials—clean water, food, energy, shelter, clothing, and infrastructure—at levels sufficient to support the society’s existing population.
Global Non Renewable Natural Resource (NNR) Supply Shortfall Analysis Overview
The Global NNR Supply Shortfall Analysis assesses the probability of permanent global supply shortfalls associated with 26 NNRs between now and the year 2030.
Specifically, the analysis compares historic and projected annual global NNR extraction levels associated with each NNR through the year 2030, with the actual or projected peak extraction level associated with the NNR. An imminent and permanent global NNR shortfall is considered probable if the annual global NNR extraction level has already reached its global peak extraction level, or if the projected annual global NNR extraction level is expected to reach its projected global peak extraction level by the year 2030.
The probabilities that a NNR will experience a permanent global supply shortfall by the year 2030 are defined as follows:
Nearly Certain Probability: it is very likely that the actual annual global NNR extraction level reached its geological global peak extraction level prior to the year 2010.
Very High Probability: the actual annual global NNR extraction level exceeded its projected (Verhulst) global peak extraction level prior to the year 2010.
High Probability: it is very likely that the projected annual global NNR extraction level will exceed its projected (Verhulst) global peak extraction level between the years 2010 and 2030.
Low Probability: it is very unlikely that the projected annual global NNR extraction level will exceed its projected (Verhulst) global peak extraction level prior to the year 2030.
Global Non Renewable Natural Resource (NNR) Supply Shortfall Assessment
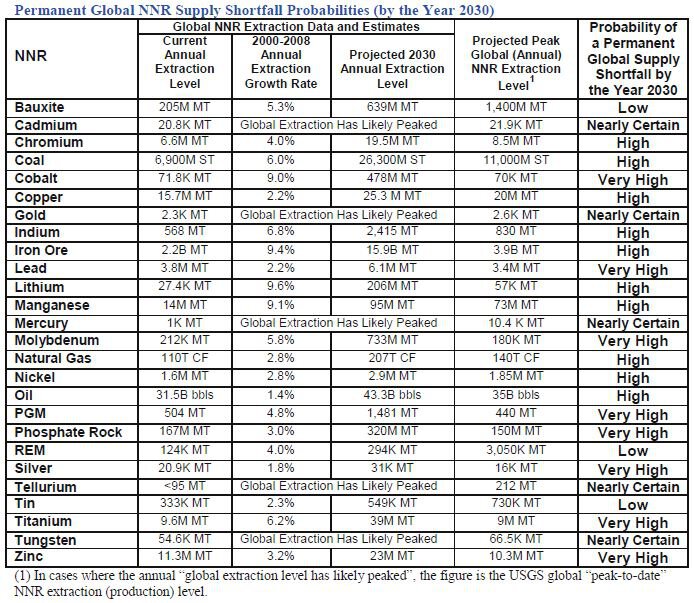
The following table contains current (2007/2008) annual global NNR extraction level data, year 2030 global NNR extraction level estimates, and global peak NNR extraction level estimates for each of the 26 analyzed NNRs. 12 The table also notes the probability that each of the 26 NNRs will experience a permanent global supply shortfall by the year 2030.
Global Non Renewable Natural Resource (NNR) Supply Shortfall Assessment
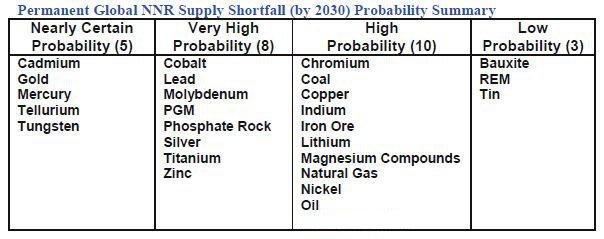
Twenty three (23) of the 26 analyzed NNRs (88%) will likely experience permanent global NNR supply shortfalls by the year 2030—available global supplies associated with these NNRs will fail permanently to meet global NNR demand by that time. Specifically:
Actual annual global extraction levels associated with cadmium, gold, mercury, tellurium, and tungsten have likely reached their geological global peak extraction levels, and are in terminal decline worldwide.
The probability that these NNRs will experience permanent global supply shortfalls by the year 2030 is nearly certain, assuming near term recoveries to pre-recession NNR extraction levels and growth rates, and the continued inability of recycled NNRs to more than offset ever-tightening newly extracted supplies.13
Actual annual global extraction levels associated with cobalt, lead, molybdenum, PGM, phosphate rock, silver, titanium, and zinc exceeded their projected Verhulst global peak extraction levels prior to the year 2010. Current annual global extraction levels associated with these NNRs are likely near or at their geological global peak extraction levels.
The probability that these NNRs will experience permanent global supply shortfalls by the year 2030 is very high, assuming near term recoveries to pre-recession NNR extraction levels and growth rates, and the continued inability of recycled NNRs to more than offset ever-tightening newly extracted supplies.13
Actual annual global extraction levels associated with chromium, coal, copper, indium, iron ore, lithium, magnesium compounds, natural gas, nickel, oil, and phosphate rock are expected to exceed their projected Verhulst global peak extraction levels between the years 2010 and 2030.
The probability that these NNRs will experience permanent global supply shortfalls by the year 2030 is high, assuming near term recoveries to pre-recession NNR extraction levels and growth rates, and the continued inability of recycled NNRs to more than offset ever-tightening newly extracted supplies.13
Actual annual global extraction levels associated with bauxite, rare earth minerals, and tin are not expected to exceed their projected Verhulst global peak extraction levels prior to the year 2030.
The probability that these NNRs will experience permanent global supply shortfalls by the year 2030 is low, unless future NNR extraction levels and growth rates far exceed pre-recession extraction levels and growth rates, due to unforeseen increases in global demand.
Note that national and/or regional NNR supply shortfalls should be expected to occur, primarily for geopolitical reasons,14 even though global NNR supplies remain at sufficient levels to fully address global demand.
Global Non Renewable Natural Resource (NNR) Supply Shortfall Analysis Findings
Fifty (50) of the 57 NNRs (88%) analyzed in the Global NNR Scarcity Analysis experienced global scarcity—and therefore experienced temporary (at least) global supply shortfalls—during the 2000-2008 period. Twenty three (23) of the 26 NNRs (88%) analyzed in the Global NNR Supply Shortfall Analysis are likely to experience permanent global supply shortfalls by the year 2030.
Each permanent NNR supply shortfall represents another crack in the foundation of our globalizing industrial lifestyle paradigm; at issue is which crack or combination of cracks will cause the structure to collapse?
Permanent global supply shortfalls associated with a single critical NNR or with a very few secondary NNRs can be sufficient to cause significant lifestyle disruptions—population level reductions and/or material living standard degradation.
A permanent shortfall in the global supply of oil, for example, would be sufficient to cause significant local, national, and/or global lifestyle disruptions, or outright global societal collapse; as would permanent global supply shortfalls associated with 2-3 critical NNRs such as potassium, phosphate rock, and (fixed) nitrogen; as would concurrent permanent global supply shortfalls associated with 4-5 secondary NNRs such as the alloys, catalysts, and reagents that enable the effective use of critical NNRs.15
Given our vulnerability to an ever-increasing number of imminent and permanent global NNR supply shortfalls, the likelihood that the mix and volume of shortfalls will reach their “critical mass” is a question of “when”, not “if”.
Implications of Increasing Global Non Renewable Natural Resource (NNR) Scarcity
Increasing Non Renewable Natural Resource (NNR) Scarcity
Available supplies associated with an overwhelming majority of NNRs—including bauxite, copper, iron ore, magnesium, manganese, nickel, phosphate rock, potash, rare earth metals, tin, and zinc—have reached their domestic US peak extraction levels, and are in terminal decline.16
Based on the evidence presented above, available supplies associated with a vast majority of NNRs are becoming increasingly scarce globally as well.
Because global NNR supplies are transitioning from “continuously more and more” to “continuously less and less”, our global societal wellbeing levels— our economic activity levels, population levels, and material living standards—are transitioning from “continuously more and more” to “continuously less and less” as well.
America — an Example of “Advanced” Non Renewable Natural Resource (NNR) Scarcity
An US NNR Scarcity Analysis was conducted to assess the incidence of NNR scarcity associated with fifty eight (58) NNRs in the United States.17 The salient findings:
- Annual US production levels associated with 50 of the 58 analyzed NNRs have reached their geological US peak production levels;
- Twenty five (25) of the 58 analyzed NNRs are no longer being produced in the US at all;
- The US currently imports some quantity of 46 of the 58 analyzed NNRs; and
- For 18 of the 58 analyzed NNRs, the US imports 100% of its current annual utilization level.
America has been able to supplement its continuously decreasing domestic NNR production levels—thereby forestalling fatal NNR supply shortfalls—by:
- Importing ever-increasing quantities of NNRs from foreign nations;
- Outsourcing US manufacturing operations to foreign offshore locations, thereby utilizing foreign NNRs; and
- Becoming a net importer of foreign goods and services, thereby utilizing foreign NNRs throughout the product/service production and provisioning processes.
Increasing Global Non Renewable Natural Resource (NNR) Scarcity

So long as 1.2 billion people seek to perpetuate their industrialized lifestyles and billions more actively aspire to an industrialized way of life, global NNR requirements and demand levels will increase unabated—while ever-tightening NNR supplies will continue to approach and reach their global peak levels.
The result of this demand/supply imbalance is a fundamental shift in the relationship among global NNR demand levels, supply levels, and utilization levels.
We are evolving from a “demand driven” NNR utilization paradigm in which our NNR utilization levels are determined by ever-increasing NNR demand, which is always met with ever-increasing supplies; to a “supply constrained” NNR utilization paradigm in which our NNR utilization levels will be determined by continuously decreasing NNR supplies, which will fail increasingly to keep pace with demand.
While the US has been able to rely on foreign NNR sources to offset its continuously decreasing domestic NNR production levels, the world has no such “safety net”—there is only one earth.
What Happens Next?
Throughout our historic era of “continuously more and more”, the causal chain associated with our lifestyle paradigm operated as follows:

Abundant and cheap NNR supplies, which served as the primary inputs to our ever-expanding, industrializing global economy, enabled the continuously expanding output of affordable goods and services; which, in turn, enabled continuously improving material living standards for ever-increasing numbers of our ever-increasing global population.
As we evolve into our new reality of “continuously less and less”, the causal chain associated with our lifestyle paradigm is evolving as well:

Increasingly scarce and expensive global NNR supplies will fail increasingly to meet the requirements (demand) associated with our ever-expanding, industrializing global economy.

The result will be a cascading array of increasingly severe NNR supply shortfalls that will give rise to a series of increasingly numerous, severe, and protracted national and global economic contractions, which will culminate in the collapse of our NNR-dependent national and global economies.

Because our collapsed economies will be unable to produce and provision societal essentials — clean water, food, energy, shelter, clothing, and infrastructure — at levels sufficient to support our prevailing population levels; our global human society will collapse as well.
All industrialized and industrializing nations, irrespective of their political and economic orientations, will collapse completely, taking the aid-dependent, non-industrialized world with them.
Under the best case scenario, a surviving global human population of a few million will remain to scavenge among the remnants of decimated natural resource reserves and severely degraded natural habitats. Under the worst case scenario, we will annihilate ourselves through global nuclear war.
When?
Eighty eight percent (88%) of the NNRs analyzed in the Global NNR Scarcity Analysis experienced (at least) temporary global supply shortfalls during the 2000-2008 period. Eighty eight percent (88%) of the NNRs analyzed in the Global NNR Supply Shortfall Analysis are likely to experience permanent global supply shortfalls by the year 2030.
That we will completely avoid permanent global NNR supply shortfalls going forward is impossible; that we will encounter an increasing number of permanent and ultimately fatal global NNR supply shortfalls in the not-too-distant future is nearly certain.
Assuming that—
- We encounter an increasing number of permanent global NNR supply shortfalls during the next 10-20-30 years, and that among these are fatal supply shortfalls associated with one or more fossil fuels, fertilizer components, primary metals, and/or critical industrial materials; and
- We resort increasingly to conflict as our primary means of allocating remaining NNRs and derived goods and services, as global supply shortfalls become increasingly disruptive and we become increasingly desperate;18
—our industrial lifestyle paradigm will almost certainly continue to unravel over the next human generation (25-30 years); and the unraveling will almost certainly devolve into complete global societal collapse within two human generations (50-60 years)—at the latest.

Of the myriad problems confronting humanity today, increasing global NNR scarcity is the most daunting; and it is the one problem that we cannot solve—it is our Achilles heel.

Footnotes
1 The term “industrial” as used here includes all post-agrarian societal designations such as “postindustrial”, “advanced”, “modern”, and “developed”; all of which describe human populations that rely heavily upon non renewable natural resources.
2 Estimated US non renewable materials (minerals) as a percentage of total US mineral utilization in the year 1800: US per capita mineral use in 1800 was ~1500 lbs. – http://www.mii.org/pdfs/Minerals1776vsToday.pdf. Total US energy consumption in 1800 was .47 quadrillion BTUs, all generated from biomass [wood] – http://www.eia.doe.gov/emeu/aer/txt/stb1701.xls. Given that the energy content of wood averages ~20 million BTUs per cord –
http://hearth.com/econtent/index.php/articles/heating_value_wood , ~23.5 million cords of wood were used that year for “energy generation” purposes alone; this equates to ~4.43 cords/person on average, given an 1800 US population of 5.3 million – http://www.measuringworth.com/. A cord of hardwood weighs ~5000 lbs.; a cord of soft wood weighs ~3000 lbs – http://www.csgnetwork.com/logweight.html; assuming only 3,000 lbs./cord, the 4.43 cords/person equates to 13,300 lbs. of energy-related wood use per capita in 1800. The 13,300 lbs. figure does not include wood used for building and construction purposes; nor does it include agricultural material flows into the economy that year. Even so, the 1,500 lbs. of mineral use combined with the 13,300 lbs. of energy-related wood use produce a total of nearly 15,000 lbs. of material resources used per person in 1800, of which approximately 90% were renewable. It can be readily asserted that with the inclusion of “non-energy” wood use and agricultural material use, well over 90% of the material resources flowing into the US economy in 1800 were renewable; less than 10% were non renewable.
3 Estimated US non renewable materials (minerals) as a percentage of total US mineral utilization in the year 2007: the 2006 percentage of renewable materials flowing into the US economy from the Wagner USGS study was ~5% (see “the Mineral Mountain” and pgs. 20-24); non renewables accounted for approximately 95% of the materials flowing into the US economy that year; “Economic Drivers of Mineral Supply”, Lori Wagner et al., USGS, 2002 – http://pubs.usgs.gov/of/2002/of02-335/of02-335.pdf.
4 2008 data from “2008 Mineral Baby”, Mineral Information Institute, 2009 – http://www.mii.org/pdfs/2009miiMineralsBaby.pdf; 1800 data from “The American Lifestyle”, pg. 3 (1776 estimate of 1200 pounds per capita extrapolated to 1500 pounds per capita in 1800); Mineral Information Institute, 2006 – http://www.mii.org/pdfs/Minerals1776vsToday.pdf.
5 Lawrence Smith estimates that 1.2 billion people currently reside in industrialized countries; from “Growth and Dispersal: A Planet on the Move”, (The Population Institute), 2006 – http://www.populationinstitute.org/newsroom/pi-in-the-news/index.php?&id=47 .
6 The term “Nature”, as used here, refers to the inestimable number of physical, chemical, geological, and biological processes and phenomena that define the physical world in which we live; neither consciousness nor a physical manifestation is attributed to “Nature”.
7 Colin Campbell explains the depletion function associated with non renewable natural resources and provides examples pertaining to oil depletion in “The Coming Oil Crisis”, pgs. 95-97; Colin J. Campbell, Multi-Science Publishing Company & Petroconsultants S.A; 1988.
8 “Peak” NNR production (extraction) does not imply imminent “exhaustion”. At peak, approximately half of the ultimately recoverable resource still remains to be extracted. The post-peak half of the resource is simply increasingly more energy-intensive, resource-intensive, and financially expensive to extract than the pre-peak half.
9 Global NNR Scarcity Analysis and Global NNR Supply Shortfall Analysis data sources:
• “Mineral Commodity Summaries 2009”, USGS, 2009 – http://minerals.usgs.gov/minerals/pubs/mcs/2009/mcs2009.pdf ;
• “Mineral Commodity Summaries (history)”, USGS, 2009 – http://minerals.usgs.gov/minerals/pubs/mcs/;
• “Historical Statistics for Mineral and Material Commodities in the United States”, USGS, 2009 – http://minerals.usgs.gov/ds/2005/140/;
• “Estimated Primary Energy Consumption in the United States, Selected Years, 1635-1945”, EIA – http://www.eia.doe.gov/emeu/aer/txt/stb1701.xls;
• “Primary Energy Consumption by Source”, 1949-2008”, EIA – http://www.eia.doe.gov/emeu/aer/txt/ptb0103.html;
• “World Primary Energy Production by Source, 1970-2006” – http://www.eia.doe.gov/emeu/aer/txt/ptb1101.html;
• “Crude Oil Production and Crude Oil Well Productivity, 1954-2008”, EIA – http://www.eia.doe.gov/emeu/aer/txt/stb0502.xls;
• “Petroleum Overview, 1949-2008”, EIA – http://www.eia.doe.gov/emeu/aer/txt/stb0501.xls.
• “Natural Gas Overview, 1949-2008”, EIA – http://www.eia.doe.gov/emeu/aer/txt/stb0601.xls;
• “Coal Overview, 1949-2008”, EIA – http://www.eia.doe.gov/emeu/aer/txt/stb0701.xls;
• “Crude Oil Domestic First Purchase Prices, 1949-2008, EIA – http://www.eia.doe.gov/emeu/aer/txt/stb0518.xls;
• “Natural Gas Wellhead, City Gate, and Import Prices, 1949-2008”, EIA – http://www.eia.doe.gov/emeu/aer/txt/stb0607.xls;
• “Coal Prices, 1949-2008”, EIA – http://www.eia.doe.gov/emeu/aer/txt/stb0708.xls;
• “World Proved Reserves of Oil and Natural Gas, Most Recent Estimates”, EIA, 3 March 2009 (I used arithmetic averages) – http://www.eia.doe.gov/emeu/international/reserves.html; worldwide coal reserves range from 662 BST (Rutledge) to 930 BST (EIA)—I took the average;
• “World Energy Use (2003)”, Arthur Smith, 2005 (year 1900 data) – http://www.altenergyaction.org/mambo/index2.php?option=com_content&do_pdf=1&id=11
• “On American Sustainability”, pgs. 45-48; Chris Clugston, 2009 – http://www.wakeupamerika.com/PDFs/On-American-Sustainability.pdf .
• “Minerals Depletion”, Dr. L. David Roper, 2010 – http://www.roperld.com/science/minerals/minerals.htm.
• “Compound Interest Calculator – http://www.1728.com/compint.htm; and
• “The Inflation Calculator” – http://www.westegg.com/inflation/infl.cgi.
10 All price levels are inflation adjusted to year 2000 USD using “The Inflation Calculator” – http://www.westegg.com/inflation/infl.cgi.
11 For an explanation of the Verhulst logistics function and its applicability to projecting NNR depletion see – “Depletion Theory”, Dr. L. David Roper, 1976 – http://www.roperld.com/science/minerals/DepletTh.pdf and “Verhulst Function for Modeling Mineral Depletion”, Dr. L. David Roper, 2009 – http://www.roperld.com/science/minerals/VerhulstFunction.htm .
12 The projected 2030 annual global NNR extraction level was calculated by extrapolating the current (2007 or 2008) annual global NNR extraction level out to the year 2030 using the pre-recession (2000-2008) compound annual growth rate. The projected peak global NNR extraction level was determined by applying Verhulst logistics modeling (curve fitting) to historic annual global NNR extraction level data and the USGS global NNR “reserve base” estimate (the larger of the two USGS estimates of ultimately recoverable resources).
13 NNR price levels increased during the pre-recession years of the 21st century, thereby indicating that “total” global NNR supply, including recycled NNRs, failed to keep pace with total global NNR demand.
14 “Continuously Less and Less—the New American Reality, pg. 12, Chris Clugston, 2009 – http://www.wakeupamerika.com/PDFs/Continuously-Less-and-Less.pdf .
15 See “Liebig’s Law of the Minimum”, Wikipedia – http://en.wikipedia.org/wiki/Rare_earth_element.
16 “Continuously Less and Less—the New American Reality, pgs. 16-19, Chris Clugston, 2009 – http://www.wakeupamerika.com/PDFs/Continuously-Less-and-Less.pdf .
17 “Continuously Less and Less—the New American Reality, pgs. 16-25, Chris Clugston, 2009 – http://www.wakeupamerika.com/PDFs/Continuously-Less-and-Less.pdf .
18 See “Continuously Less and Less—the New American Reality, pgs. 34-36, for a discussion on America’s impending societal collapse. Conflicts over remaining natural resources, both NNRs and RNRs, will become increasingly prevalent on both national and international levels. Chris Clugston, 2009 –
http://www.wakeupamerika.com/PDFs/Continuously-Less-and-Less.pdf.
Author Bio (Chris Clugston): For the past four years I conducted extensive independent research into the area of sustainability, the goals of which were to quantify from a combined ecological and economic perspective the extent to which both American society and humanity are currently overextended—i.e. living unsustainably beyond our means—and to understand the causes and consequences associated with our predicament.
Prior to that I spent thirty years working with information technology sector companies in marketing, sales, finance, M&A, and general management—the last twenty as a corporate chief executive and management consultant. I received an AB/Political Science, Magna Cum Laude and Phi Beta Kappa from Penn State University, and an MBA/Finance with High Distinction from Temple University in Philadelphia, PA. I can be reached at coclugston “at” comcast “dot” net.
Note: In this report I have integrated the exact content of the original source, to be certain that this information is retained. If you would like to read this report on the website of the original publisher I recommend you to click the source link below.