One method investors can use to determine the future price of gold is the Dow to Gold ratio, which looks at how many ounces of gold it takes to purchase all the companies in the Dow Jones index, assuming every point in the index represents one dollar. The Dow to Gold ratio chart shows that there have been periods in history where investors have lost confidence in paper assets, referred to as financial crisis, which have occurred shortly after the performance of the Dow Jones index has peaked.
How to Calculate Today’s Dow to Gold Ratio Yourself
To calculate today’s Dow to Gold ratio, divide the value of the Dow Jones index by the value of the gold price. While calculating the ratio yourself may be too much work, live charts are available online, such as this one: https://ingoldwetrust.report/chart-dow-jones-gold-ratio/?lang=en
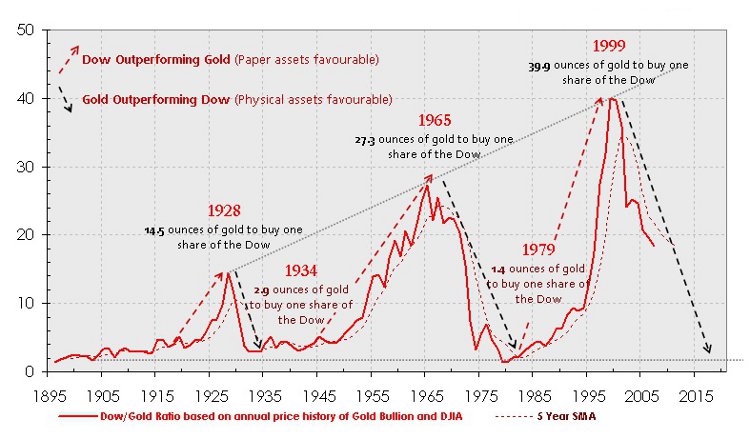
The Dow to Gold ratio appears to move in cycles, where peak levels are reached at a high Dow Jones Index and the bottom of the cycle is found when it takes only a couple of ounces of gold to buy the Dow. For example, it took only 2.9 ounces in 1934, 1.4 ounces in 1979, and 6.5 ounces in 2011.